from sklearn import datasets
diabetes = datasets.load_diabetes()
print(diabetes.DESCR)
.. _diabetes_dataset:
Diabetes dataset ----------------
Ten baseline variables, age, sex, body mass index, average blood pressure, and six blood serum measurements were obtained for each of n = 442 diabetes patients, as well as the response of interest, a quantitative measure of disease progression one year after baseline.
**Data Set Characteristics:**
:Number of Instances: 442
:Number of Attributes: First 10 columns are numeric predictive values
:Target: Column 11 is a quantitative measure of disease progression one year after baseline
:Attribute Information: - age age in years - sex - bmi body mass index - bp average blood pressure - s1 tc, total serum cholesterol - s2 ldl, low-density lipoproteins - s3 hdl, high-density lipoproteins - s4 tch, total cholesterol / HDL - s5 ltg, possibly log of serum triglycerides level - s6 glu, blood sugar level
Note: Each of these 10 feature variables have been mean centered and scaled by the standard deviation times `n_samples` (i.e. the sum of squares of each column totals 1).
For more information see: Bradley Efron, Trevor Hastie, Iain Johnstone and Robert Tibshirani (2004) "Least Angle Regression," Annals of Statistics (with discussion), 407-499. (https://web.stanford.edu/~hastie/Papers/LARS/LeastAngle_2002.pdf)
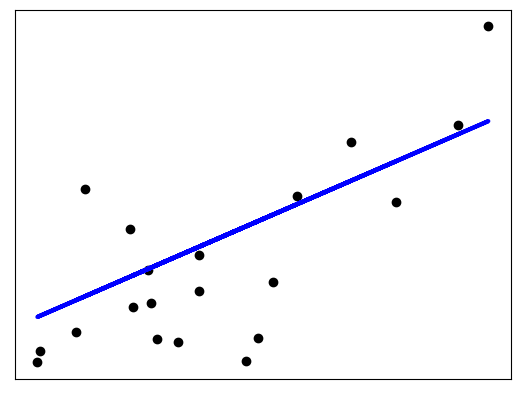
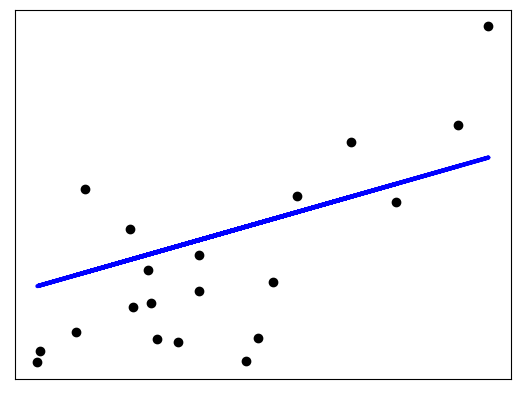
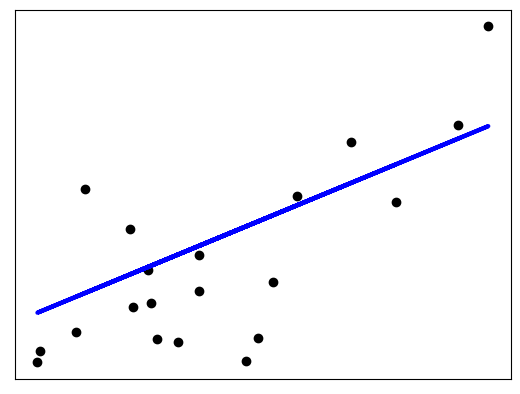
使用diabete数据集的线性模型实现
import matplotlib.pyplot as plt import numpy as np from sklearn import datasets, linear_model from sklearn.metrics import mean_squared_error, r2_score