Iris数据集是一个常用的机器学习数据集,包含了三种不同种类的鸢尾花(Iris setosa,Iris versicolor和Iris virginica)各50个样本,共计150个样本。每个样本由四个特征构成:花萼长度(sepal length)、花萼宽度(sepal width)、花瓣长度(petal length)和花瓣宽度(petal width)。
数据集的格式
Iris数据集通常以文本文件的形式存储,每个样本占一行,每个特征之间以逗号分隔,最后一个特征为类别标签。例如:
|
数据集详细信息:
|
.. _iris_dataset:

Iris plants dataset
--------------------

**Data Set Characteristics:**

    :Number of Instances: 150 (50 in each of three classes)
    :Number of Attributes: 4 numeric, predictive attributes and the class
    :Attribute Information:
        - sepal length in cm
        - sepal width in cm
        - petal length in cm
        - petal width in cm
        - class:
                - Iris-Setosa
                - Iris-Versicolour
                - Iris-Virginica

    :Summary Statistics:

    ============== ==== ==== ======= ===== ====================
                    Min  Max   Mean    SD   Class Correlation
    ============== ==== ==== ======= ===== ====================
    sepal length:   4.3  7.9   5.84   0.83    0.7826
    sepal width:    2.0  4.4   3.05   0.43   -0.4194
    petal length:   1.0  6.9   3.76   1.76    0.9490  (high!)
    petal width:    0.1  2.5   1.20   0.76    0.9565  (high!)
    ============== ==== ==== ======= ===== ====================

    :Missing Attribute Values: None
    :Class Distribution: 33.3% for each of 3 classes.
    :Creator: R.A. Fisher
    :Donor: Michael Marshall (MARSHALL%PLU@io.arc.nasa.gov)
    :Date: July, 1988

The famous Iris database, first used by Sir R.A. Fisher. The dataset is taken
from Fisher's paper. Note that it's the same as in R, but not as in the UCI
Machine Learning Repository, which has two wrong data points.

This is perhaps the best known database to be found in the
pattern recognition literature.  Fisher's paper is a classic in the field and
is referenced frequently to this day.  (See Duda & Hart, for example.)  The
data set contains 3 classes of 50 instances each, where each class refers to a
type of iris plant.  One class is linearly separable from the other 2; the
latter are NOT linearly separable from each other.

.. topic:: References

   - Fisher, R.A. "The use of multiple measurements in taxonomic problems"
     Annual Eugenics, 7, Part II, 179-188 (1936); also in "Contributions to
     Mathematical Statistics" (John Wiley, NY, 1950).
   - Duda, R.O., & Hart, P.E. (1973) Pattern Classification and Scene Analysis.
     (Q327.D83) John Wiley & Sons.  ISBN 0-471-22361-1.  See page 218.
   - Dasarathy, B.V. (1980) "Nosing Around the Neighborhood: A New System
     Structure and Classification Rule for Recognition in Partially Exposed
     Environments".  IEEE Transactions on Pattern Analysis and Machine
     Intelligence, Vol. PAMI-2, No. 1, 67-71.
   - Gates, G.W. (1972) "The Reduced Nearest Neighbor Rule".  IEEE Transactions
     on Information Theory, May 1972, 431-433.
   - See also: 1988 MLC Proceedings, 54-64.  Cheeseman et al"s AUTOCLASS II
     conceptual clustering system finds 3 classes in the data.
   - Many, many more ...
数据集的应用
Iris数据集常用于分类问题和聚类问题的实验和演示,也是许多分类算法(如支持向量机和决策树)的样例数据集。此外,Iris数据集也经常被用于探索性数据分析和可视化的案例研究。
下面我们使用Iris数据集做一些算法演示。
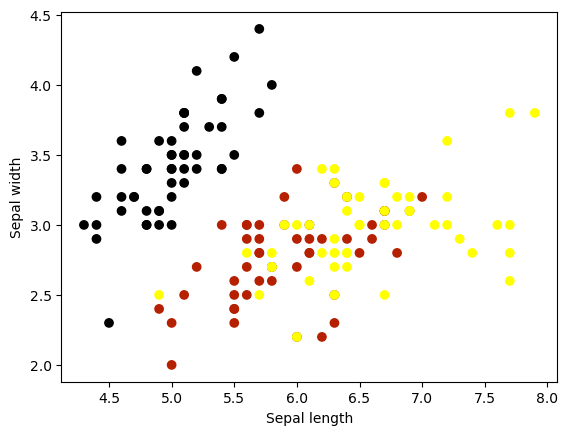
绘制花萼2d分布图
|
Text(0, 0.5, 'Sepal width')

代码说明:X_sepal = X[:, :2]
对np array取值比较灵活,上面的案例中,以逗号为界。第一个冒号是数组行的取值范围,未指定则取所有行。逗号后面则是数组列的取值范围。
冒号前面未指定,则从0开始。后面是2,表示从第0到取2-1的列。
由于X数据集中,前两列是花萼的长宽特征值,所以X[:, :2]表达的是获取数据集中所有鸢尾花花萼的特征值的数据。
那么用类似的方法,我们可以绘制花瓣的2d图
绘制花萼2d分布图
|
Text(0, 0.5, 'Sepal width')
|
模型准确性: 1.0